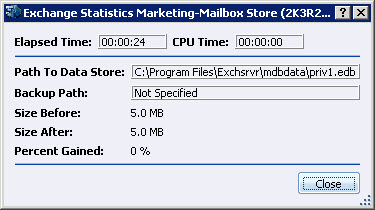
After you perform a defragmentation pass on your Exchange data stores, the Exchange Statistics window opens to display the results of that operation.
The Exchange Statistics window provides the following information:
|
Item |
Description |
|
Elapsed time |
Displays the time elapsed (in hours, minutes and seconds) during defragmentation from start to finish. |
|
CPU time |
Displays CPU time elapsed (in hours, minutes and seconds) during defragmentation from start to finish. |
|
Path to data store |
Displays path to the selected Exchange data store. |
|
Backup path |
Displays the drive path where backups are stored. |
|
Size before |
Displays the size before defragmentation and compaction. |
|
Size after |
Displays the size after defragmentation and compaction. |
|
Percent gained |
Displays the percentage of storage space reclaimed after defragmentation. |
Click Close button to close the Exchange Statistics window.
Related Topics
§ Pre-conditions for Defragmenting Exchange Data Store
§ Starting Exchange Data Store Defragmentation